Turning sports data
into decisions,
not just displays.
A series of product redesigns for Lineups.com, projections, rankings, standings, line combinations, and community predictions, each guided by the same question: what does the user actually need to decide faster?
The problem common to all sports data products
Sports data platforms tend to confuse comprehensiveness with usefulness. Dense tables with many columns, raw statistics without interpretation, and layouts that require horizontal scrolling on mobile are the default, because they were designed from the database outward, not from the user's decision inward.
Lineups.com serves bettors, fantasy players, and analysts. Each has different goals when they arrive at a page. A bettor wants to quickly identify value. A fantasy player wants to compare specific players for a lineup decision. An analyst wants full data depth. The challenge is designing experiences that serve all three without creating three separate products.
Projections widget redesign
The existing projections layout presented data correctly but without guidance. Salary and projection, the two primary decision signals for DFS users, were buried among many other columns in a dense table. On mobile, horizontal scrolling disconnected columns from their context, making comparison impossible without holding numbers in memory.
The redesign introduced a card-based layout that surfaces salary and projection as hero values for each player, with secondary stats collapsed but accessible. Position filter chips replaced the full position dropdown, reducing the selection cost for the most common filter action. The result is a page that is easier to scan on mobile without removing depth for power users who want it.
Team rankings & comparison
The team rankings page had an identified gap: the PM noted the comparison tool was missing on desktop, despite being the most useful feature for users trying to evaluate matchups. On mobile, the dense rankings table required horizontal scrolling through many columns, making comparison essentially impossible.
The proposed solution was a hybrid experience designed differently by device and intent. On mobile: a selection-first flow where users pick 2-5 teams, then see a full-width comparison chart. On desktop: the full rankings table retained with a sticky comparison toolbar at the top, users select teams from the table rows and the comparison builds inline.
The key design decision was treating the comparison as an always-available mode rather than a separate page. Users can enter and exit comparison without losing their place in the full table. This reduces the cognitive cost of using the feature enough that users who previously couldn't be bothered to navigate to a comparison tool will use it naturally within the rankings experience.
NBA/NFL/MLB depth charts
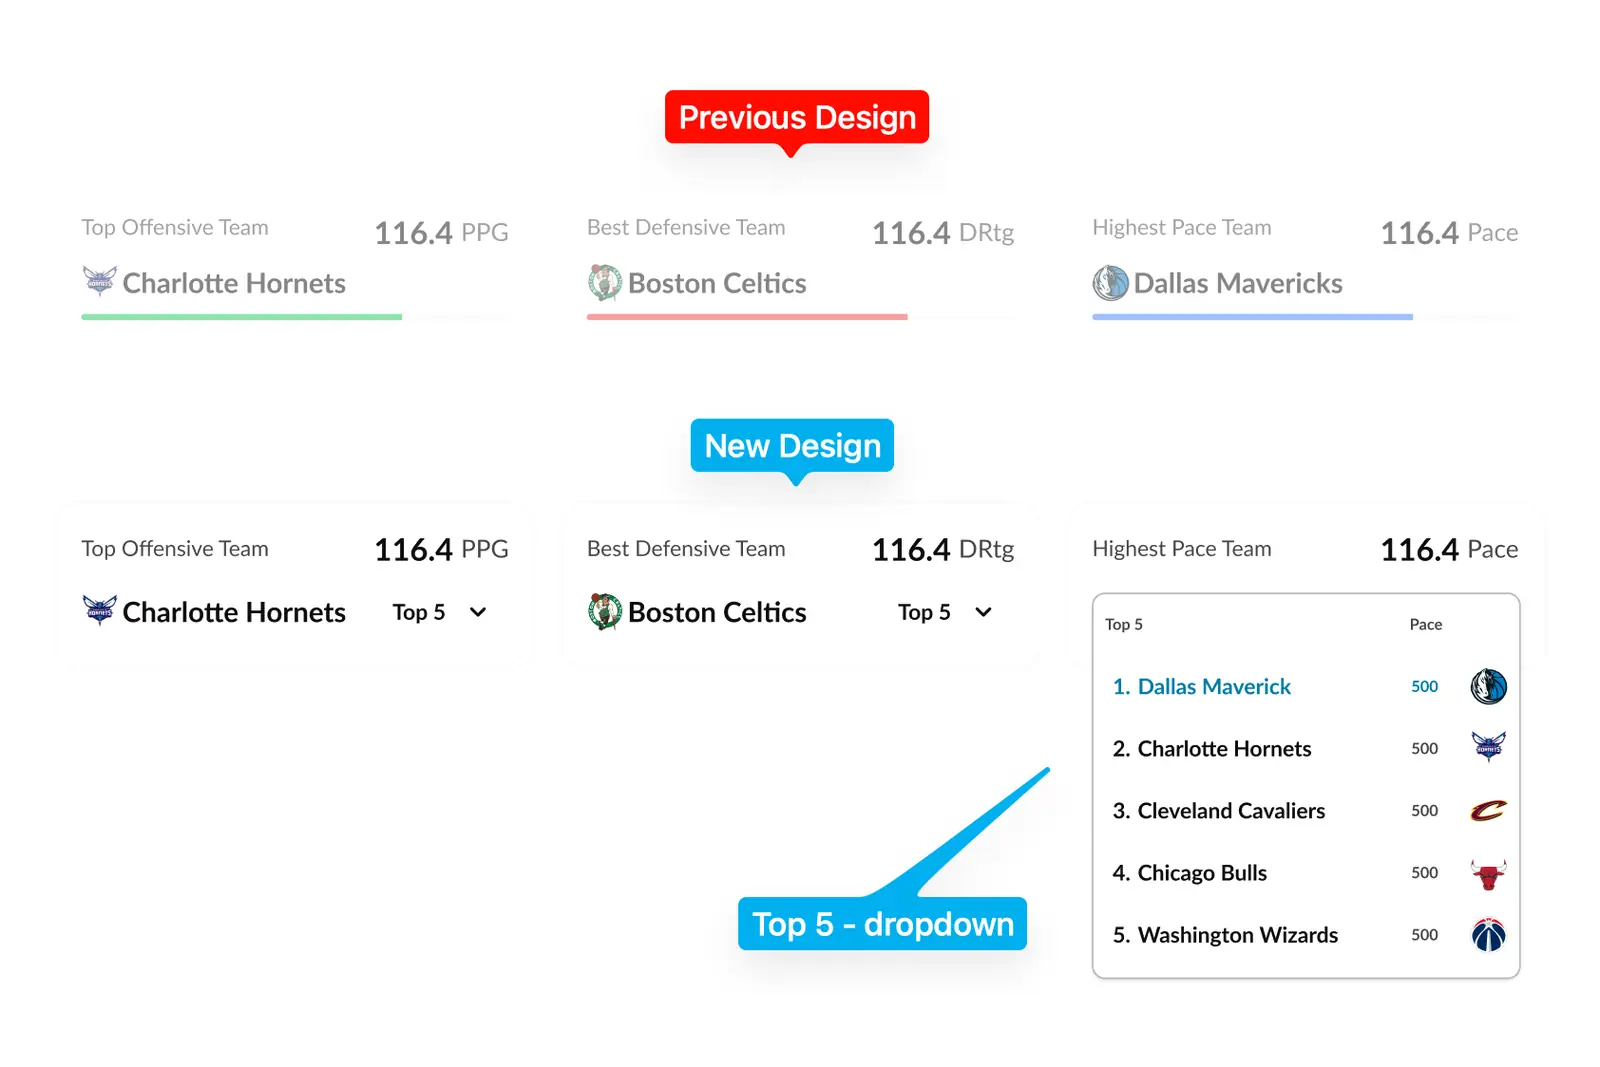
Progress bars on the depth chart category cards were replaced with Top 5 category dropdowns. The rationale was precise: a progress bar answers "how much?", a vague visual score. A ranked dropdown answers "who are the top teams?", a direct, actionable question for anyone making a betting or fantasy decision. The change also adds interactivity to what were previously passive summary blocks, increasing engagement without adding visual complexity.
NHL line combinations
The NHL Line Combinations redesign addressed a specific problem: mobile layout broke the hockey mental model. Lines collapsed into a vertical stack, removing the familiar "3 forwards across / 2 defensemen paired" visual grouping that makes lineup reading fast. The redesign preserved this structure on mobile, added a radar comparison tool at the top, and introduced team switching that doesn't require navigating away from the current page.
Standings redesign
Standings should be quick to scan. The existing table required users to decode row by row, checking columns for record, splits, streak, and games back, then holding those values in memory to compare teams. The redesign made key signals scannable at a glance: form momentum visualised inline, recent result sequences shown as compact icons, and expanded cards available for users who want deeper context without the expanded state being the default view.
Community predictions, product concept
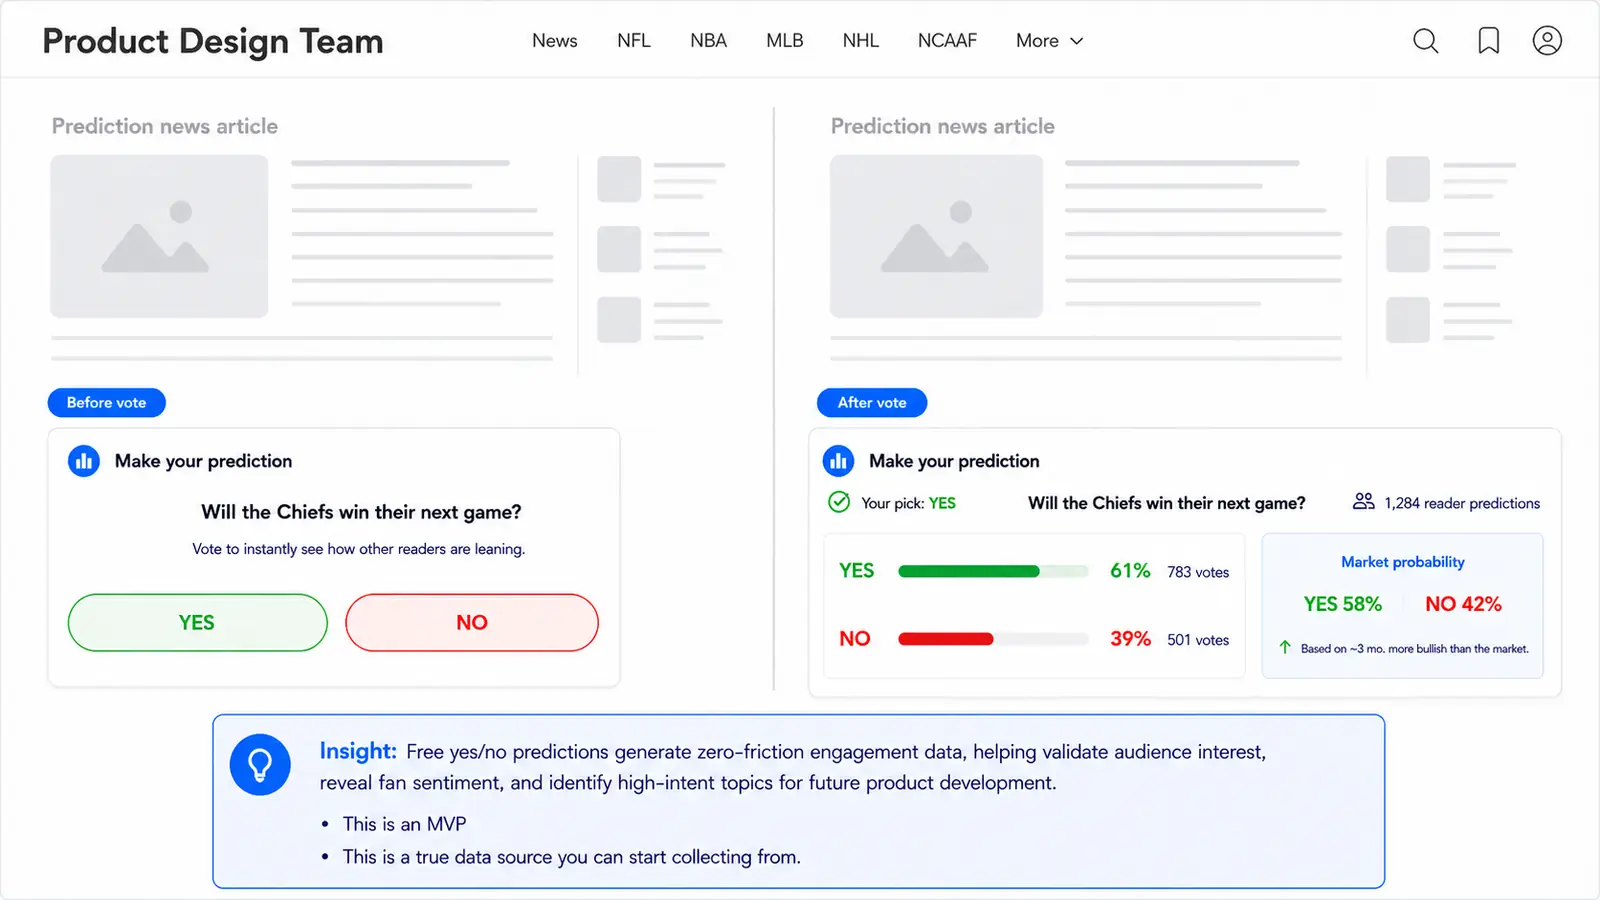
The community predictions concept was proposed as a product layer that converts Lineups from a data destination into an engagement platform. The core mechanic is simple: one daily pick per league, yes/no vote format, with immediate community results after voting. But the strategic value is significant: each vote is structured behavioural data, which topics drive engagement, which teams and players command interest, whether community sentiment diverges from market probability.
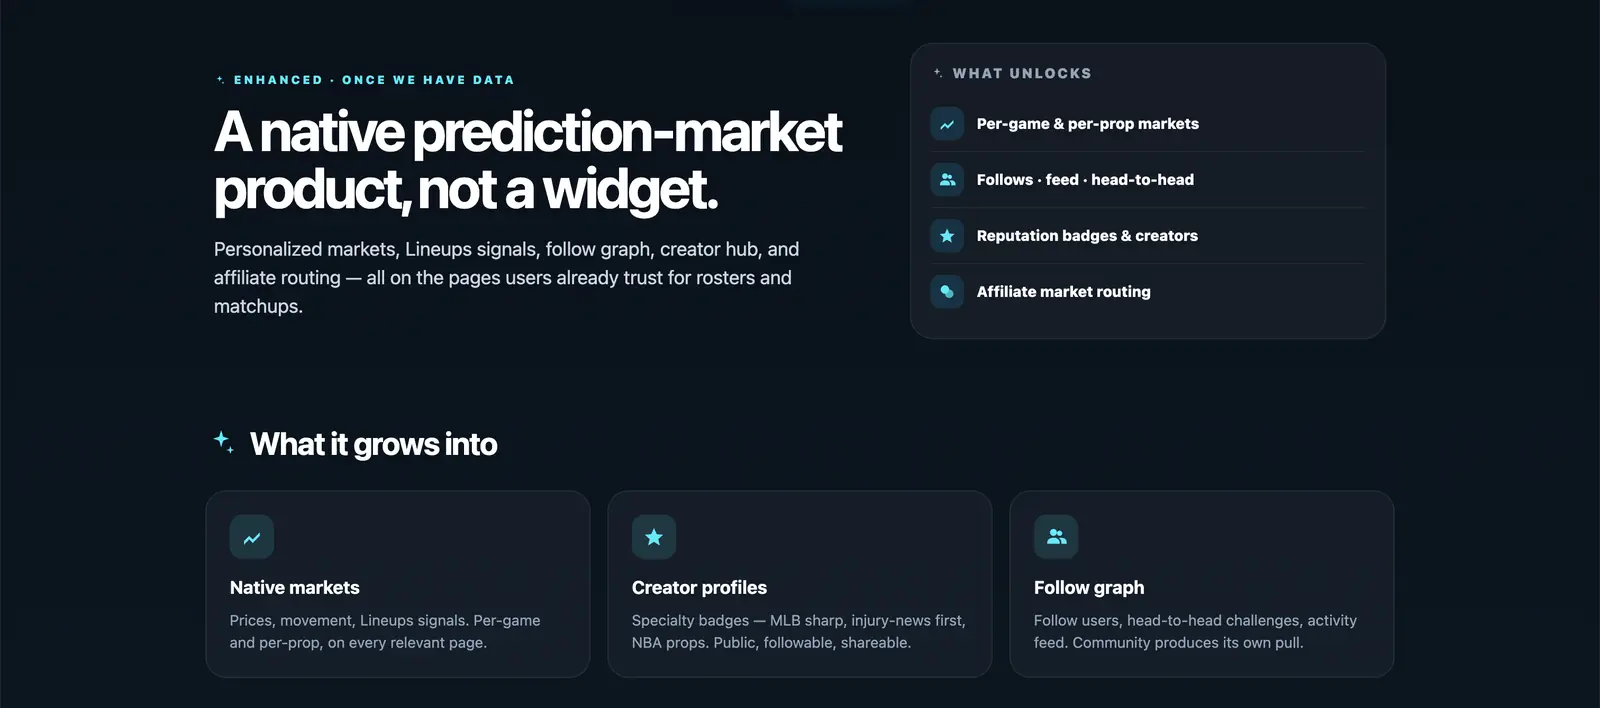
The MVP was designed to start with free daily picks to build user behaviour before any market routing. The longer-term vision is prediction markets as a native Lineups layer, powered by sports context and editorial data signals, rather than sending users to an external service like Polymarket. The distinction matters: keeping prediction activity within Lineups creates dwell time, session depth, and a dataset that can improve every other product decision.


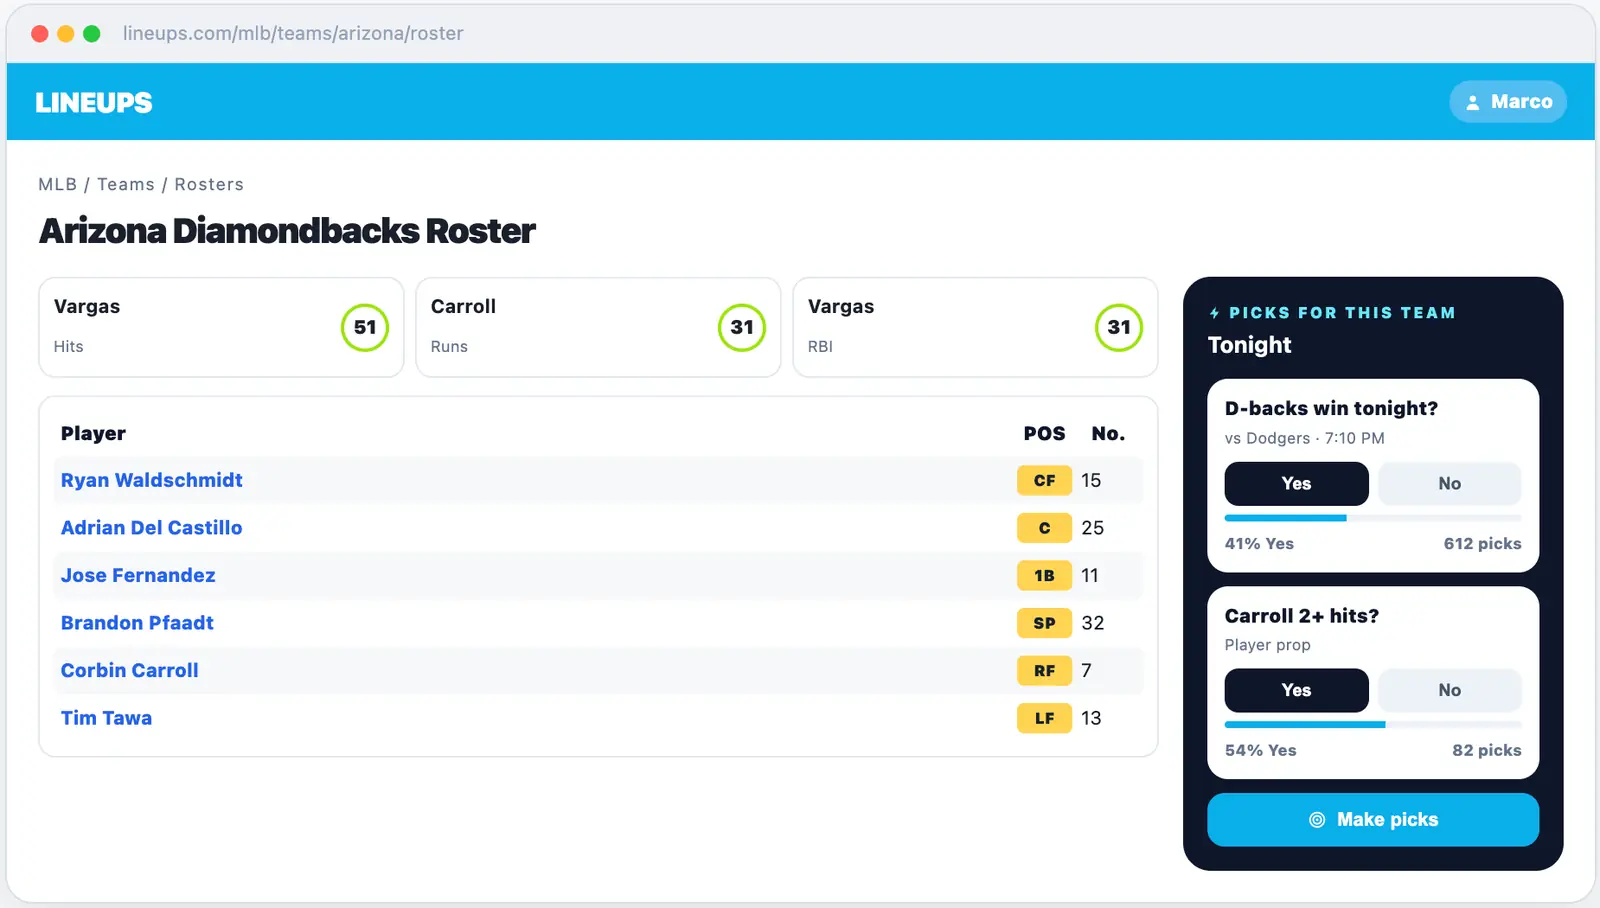
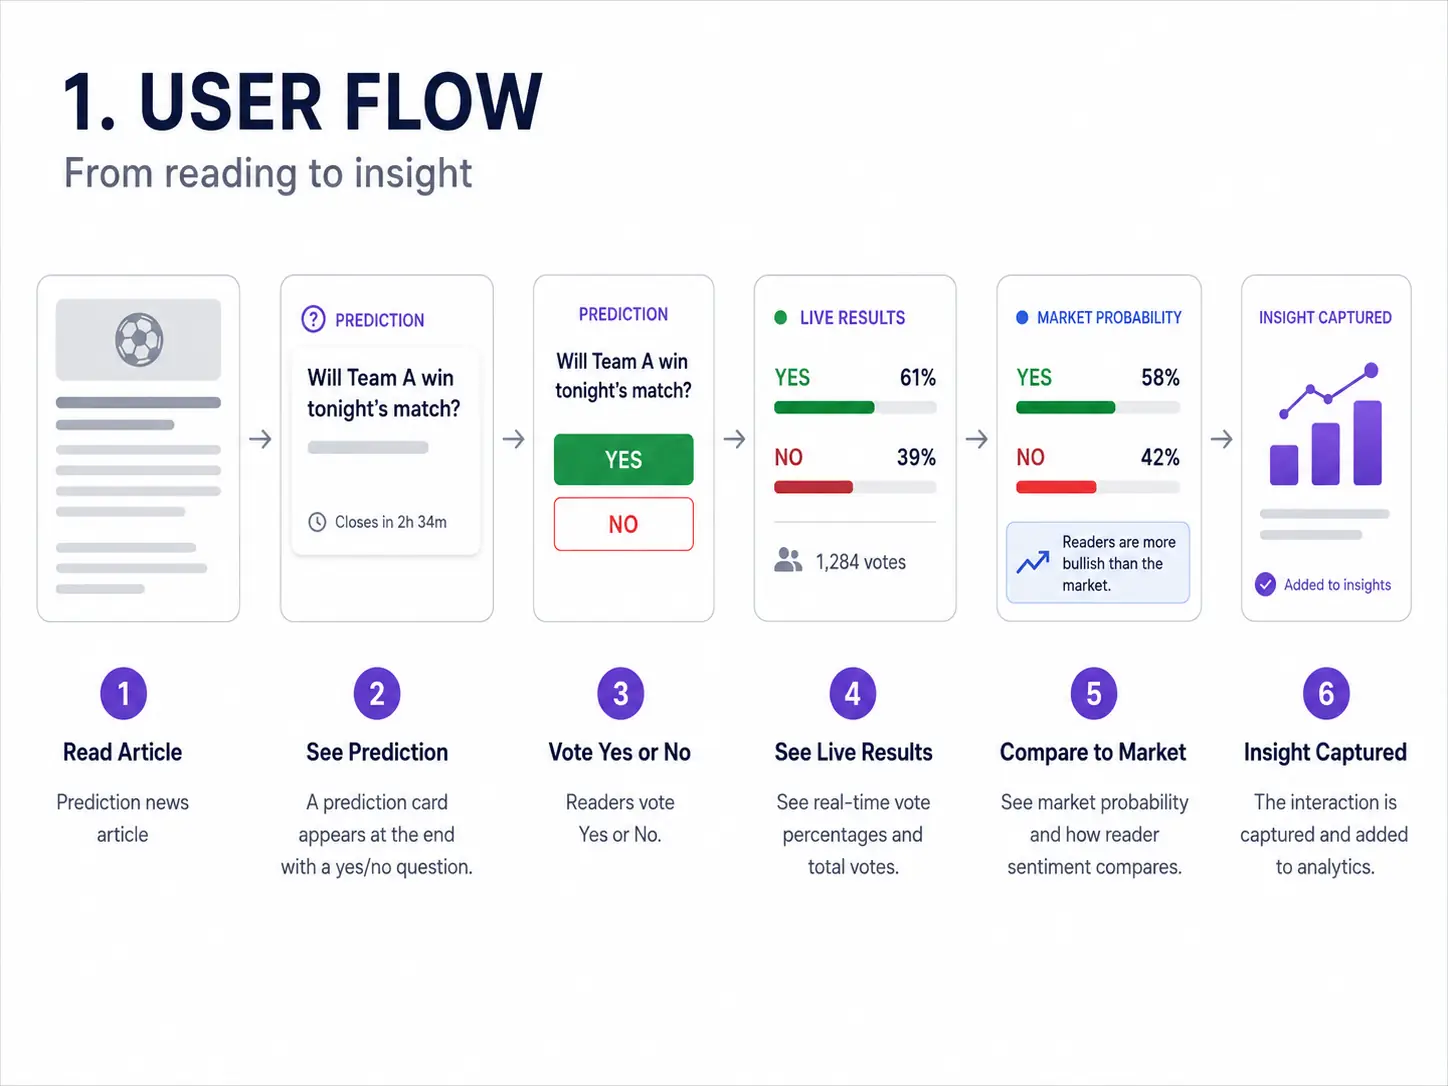
The interactive sports prediction feature for Gaming Today extends the same concept to editorial content: a yes/no prediction card embedded at the end of sports news articles. Before a vote, users see the question. After, they see live results, total votes, and a comparison against market probability. This turns passive reading into active engagement, and builds a free dataset of fan intent at scale.
Betting calculators suite
For Gaming Today, a six-calculator suite was designed: Odds Converter, Moneyline, Parlay, No-Vig, Kelly Criterion, and Martingale. Each works as a standalone utility while fitting into a broader product framework for education, engagement, and conversion. Two modes were designed, Minimal (core calculation only) and Full (visualisations, contextual offers, history, explanations), allowing users to choose depth based on intent while keeping the default experience accessible for beginners.
The commercial logic: calculators create return visits (users come back before each bet), contextual operator offers appear at the moment of maximum purchase intent, and the tools establish the site as genuinely useful rather than purely promotional.
Outcome
Qualitative assessment of the work.
The sports product work applied one framework to data-driven products: lead with the decision the user needs to make, not with the data available to support it. This distinction, decision-led rather than data-led, framed each of the redesigns.
The comparison-first redesign of team rankings and the progressive disclosure model in projections aimed to reduce the cognitive load required to reach a comparison outcome, the specific task that DFS and betting users arrive to complete. The NHL line combinations redesign preserved the mental model that hockey fans bring to the page, aiming to reduce reorientation time on mobile by maintaining the familiar spatial grouping of lines and pairs.
The Community Predictions concept set out a strategic opportunity: converting passive data consumers into active participants, and using that participation as a first-party data signal for editorial prioritisation and product personalisation. If implemented, it represents the transition from Lineups as a data tool to Lineups as an engagement platform, a fundamentally different product value proposition.